April 28, 2023
This Instagram metrics featured in this blog are derived from an analysis of the top 25% of performers out of 876 clients across seven different retail, e-commerce, and service industries.
We’ve taken the top 10 Instagram metrics and analyzed the benchmarks for each, broken down into three main categories, and presented the key findings you need to know in order to win on Instagram.
Chapters:
- Instagram Reach Rate metrics
- Instagram Engagement Rate metrics
- Instagram Stories Metrics
- 2024 Instagram metrics key takeaways
Measuring the performance of digital marketing is critical for determining its ROI. Yet, the majority of high-level marketers aren’t confident they’re doing it right. According to the 2023 CMO Survey, 64.7% of marketers surveyed believe they have room to improve when it comes to using data insights across different channels.
It’s not surprising that marketing professionals have doubts about their analytics processes since continuous changes in metrics can create a significant learning curve. When it comes to social media platforms, Instagram is one of the most valuable marketing and sales channels for e-commerce businesses — and often, one of the most challenging to navigate.
From constant platform updates to an ever-evolving algorithm, keeping up with Instagram takes dedication. But understanding how Instagram metrics impact business performance is worth the commitment. Instagram users are more engaged than Facebook or Twitter users and more likely to shop via social commerce than almost any other platform (coming in second only to Facebook).
Whether or not you’re leveraging the full potential of Instagram for business or successfully tracking your Instagram analytics, we have the key Instagram metrics you need to know in 2024. We analyzed the top 25% of performers out of 876 clients across seven different retail, e-commerce, and service industries to show you where the Instagram benchmarks are set.
The results reveal what you should measure and how you stack up against these top Instagram performers. Discover what you’re already doing well and which areas to focus on this year to crush the Instagram performance game.
Instagram Reach Rate metrics
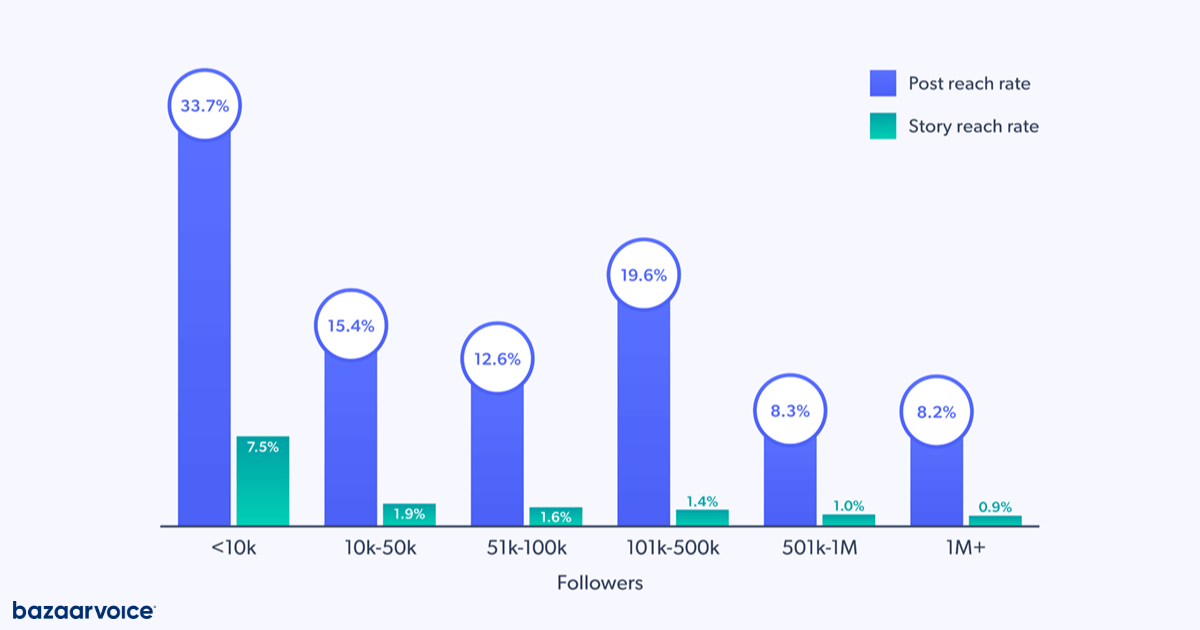
1. Reach Rate by brand size
Definition: Reach Rate is the percentage of your Instagram followers who see your post or story.
Reach Rate = Number of people who have seen your post / Followers
This might sound counterintuitive, but out of the brands analyzed, the ones with the least number of followers — fewer than 10K — have the highest post and Story Reach Rates by far. Brands with larger numbers, between 501K and 1M+ followers, have the lowest Reach Rate.
A notable change from last year’s benchmarks can be seen in the middle tiers. Last year, the second-lowest tier, brands with 10K to 50K followers, had the second-highest post reach rate, but they’ve been replaced by brands that have between 101K and 500K followers.
Larger: Brands with large followings (+501K) should aim to meet or exceed an average Reach Rate of 8% for an Instagram post and 1% for an Instagram Story.
Smaller: Brands with smaller followings should aim to meet or exceed the higher benchmark of 34% of their audience through posts and 7.5% through Stories.
2. Reach Rate’s relationship with conversion
Definition: Conversion Rate is the percentage of total visitors to your website who convert. Depending on the business goal, conversion can be making a purchase, subscribing to a newsletter, or signing up for a product trial.
Conversion Rate = Total conversions / Total visitors
Reach Rate isn’t just about getting more eyeballs on your content. It also leads to more website visitors and conversions, so it’s a valuable performance metric on multiple levels. We see higher website traffic and conversions for brands with a higher Instagram reach.
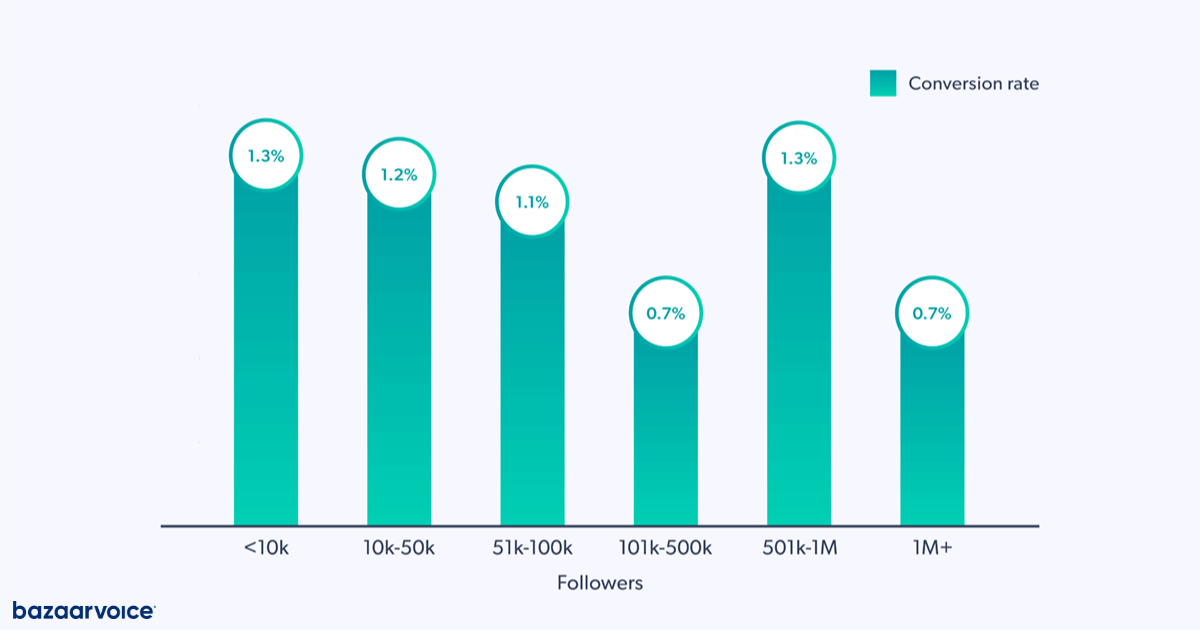
The average Conversion Rate for the top-performing brands on Instagram that we analyzed is 1%. Similar to last year’s findings, brands with smaller followings have higher conversion rates than brands with 1M+ followers. Interestingly, brands with the second-highest tier of followers, 501K to 1M, have the same conversion rates as brands with the least followers this year.
Brands with fewer than 10K followers, as well as brands with 501K to 1M followers, have the highest Conversion Rates (1.3%), followed by brands with 10K–50K followers (1.2%).
3. Reach for Stories versus posts
Unsurprisingly, Instagram benchmarks can differ depending on your industry which we’ll look at throughout this piece, starting with Instagram Stories.
Instagram Stories is an important feature for your brand’s social media marketing. The number of users actively posting Stories has steadily increased since the feature’s launch, now exceeding more than 500 million daily active users. Stories from brands account for one-third of the most-viewed Stories.
Although Instagram Stories is a popular format for content, its reach is considerably (but understandably) lower than posts since posts are permanent while Stories expire after one day. Despite this, 62% of the Instagram users who interact with Stories, “become more interested in a brand or product after seeing it in Stories,” which makes it a valuable tool for brands looking to increase their reach.
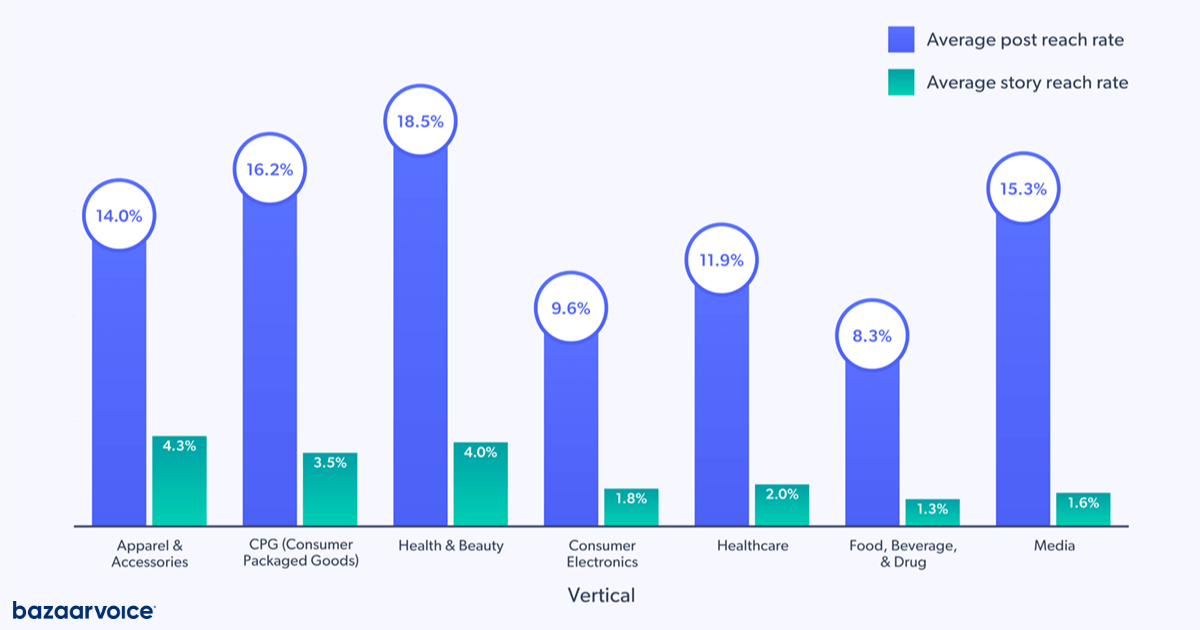
Overall, the Apparel and Accessories category (4.3%), followed by Health and Beauty (4%), has the highest story reach rate.
Instagram Engagement Rate metrics
Definition: Engagement Rate measures how many people interacted with your Instagram content compared to how many people saw it. To find that figure, divide the number of likes, comments, and saves by your follower count.
Engagement Rate = Engagements / Followers
4. Post Engagement Rate by follower size
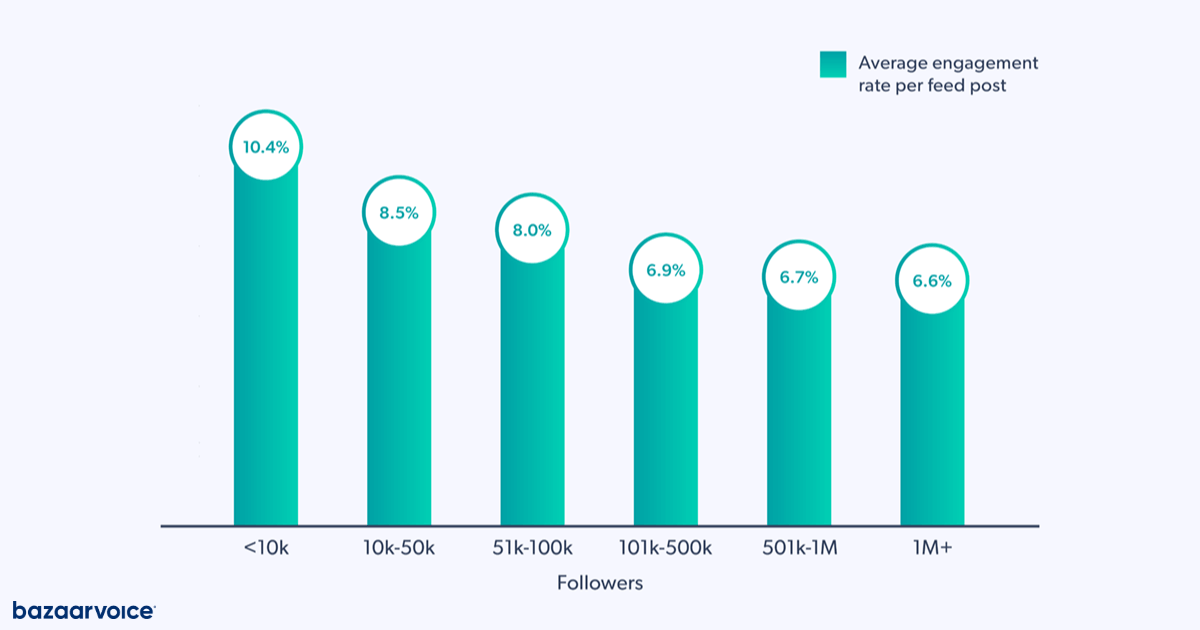
The Engagement Rate for feed posts varies based on how many followers a brand has. Ranking at the top again are brands with fewer than 10K followers, and they should aim to meet or exceed a 10% Engagement Rate.
The engagement rate declines as the number of followers increases. Brands with 1M+ followers have the lowest feed post Engagement Rate at 6.6%, although brands within the 101K to 1M tiers are close behind. Brands falling into the 10K to 100K tiers should aim for an engagement rate of 8%.
5. Engagement Rate for photos versus video
Instagram originated as a photo-based social platform, and its flagship content type still reigns supreme. But while photos have a higher Engagement Rate overall, videos on Instagram are becoming increasingly more popular. According to Instagram, 91% of active Instagram users watch videos weekly.
The results of our top-performing brands on Instagram show that the photo Engagement Rate exceeds that of video, but not by a significant amount. The average photo Engagement Rate is 8.2%, compared to 6% for video Engagement Rate.
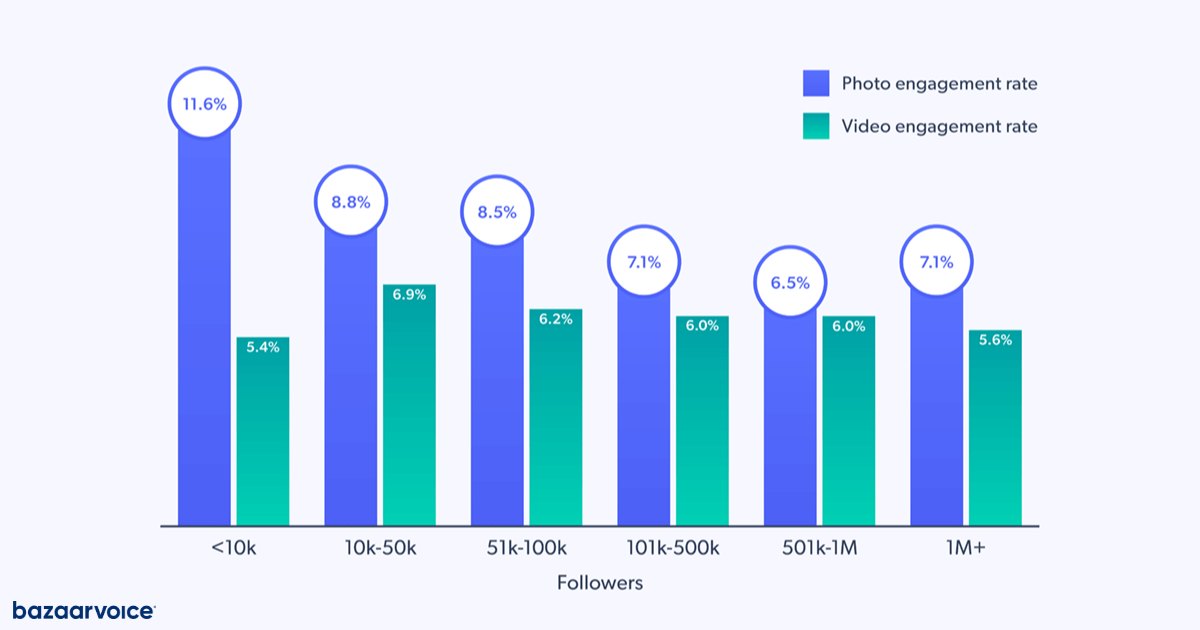
Interestingly, brands with 10K to 50K followers have the highest video engagement rate (6.9%), while the lowest tier brands, with less than 10K followers, have the lowest video engagement rate, suggesting that medium-sized followings tend to see more engagement with video content.
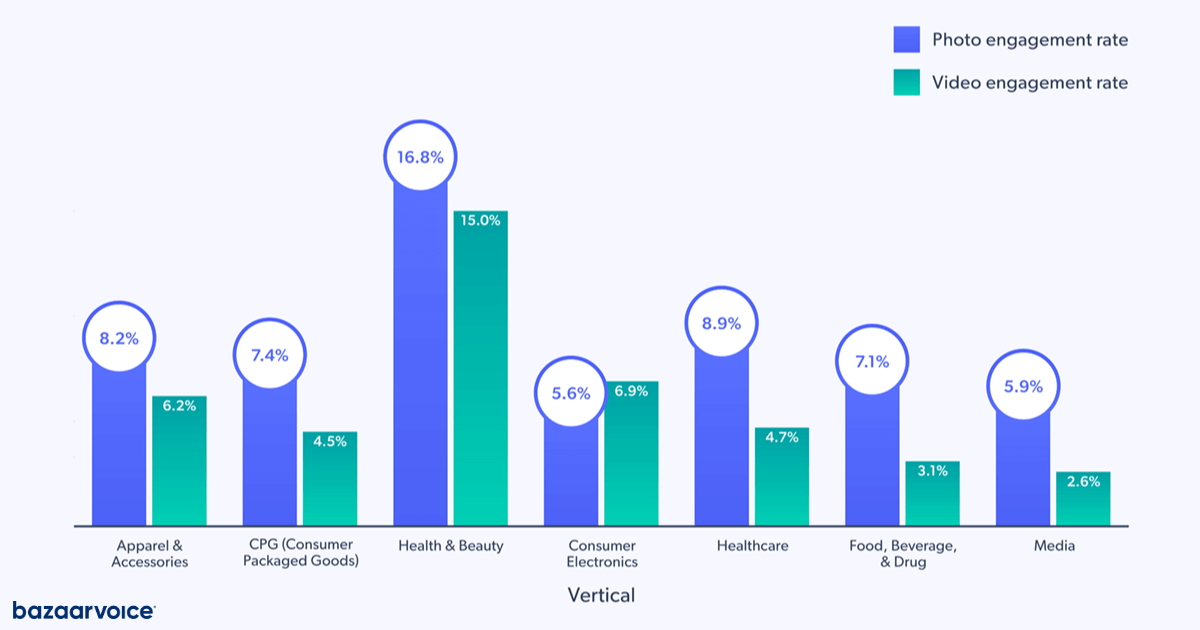
6. Visual content Engagement Rate by industry
Your industry is a significant variable to consider when assessing your photo and video Engagement Rate. With these industry benchmarks, you can see if you’re above or below top competitors in your space to guide your ongoing performance tracking.
Because of the nature of the ever-evolving and fluctuating digital marketing landscape, some industries that were on the bottom last year have moved up and vice-versa.
Health and Beauty has the highest visual Engagement Rate for video (15%) and photo (16.8%). Media is the industry with the lowest video Engagement Rate (2.6%), while Consumer Electronics is the industry with the lowest photo Engagement Rate (5.6%).
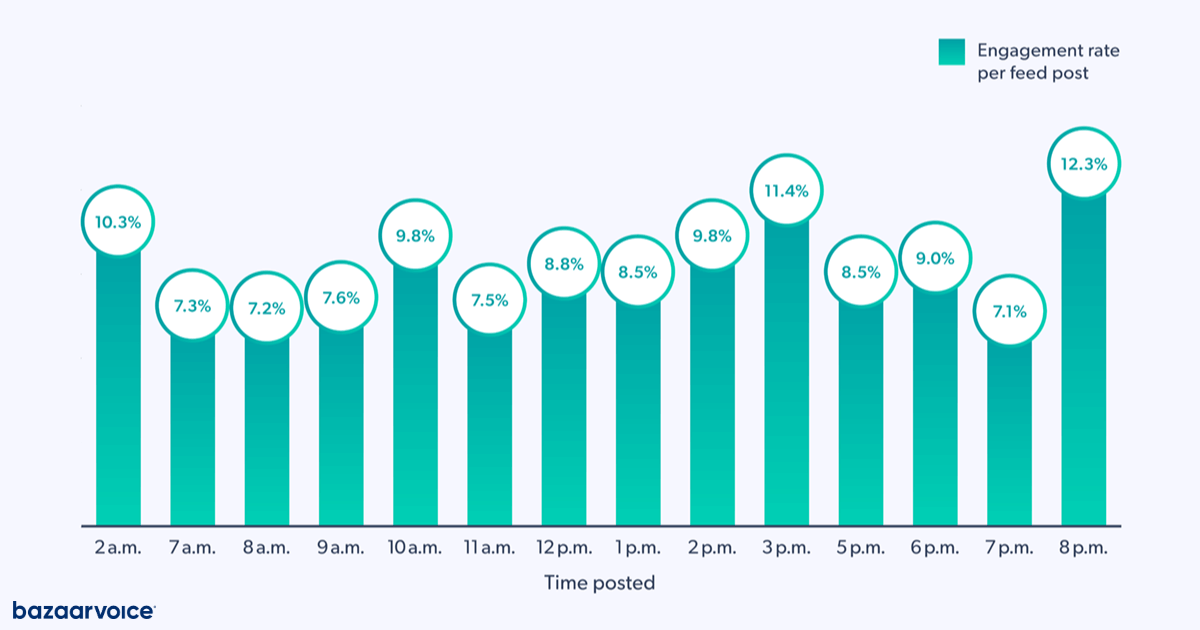
7. Most engaging times to post on Instagram
Probably the most exciting Instagram metrics for most of you. For our top performers, the posting times that result in the highest Engagement Rates are 3pm EST and 8pm EST, although 2am EST is close behind.
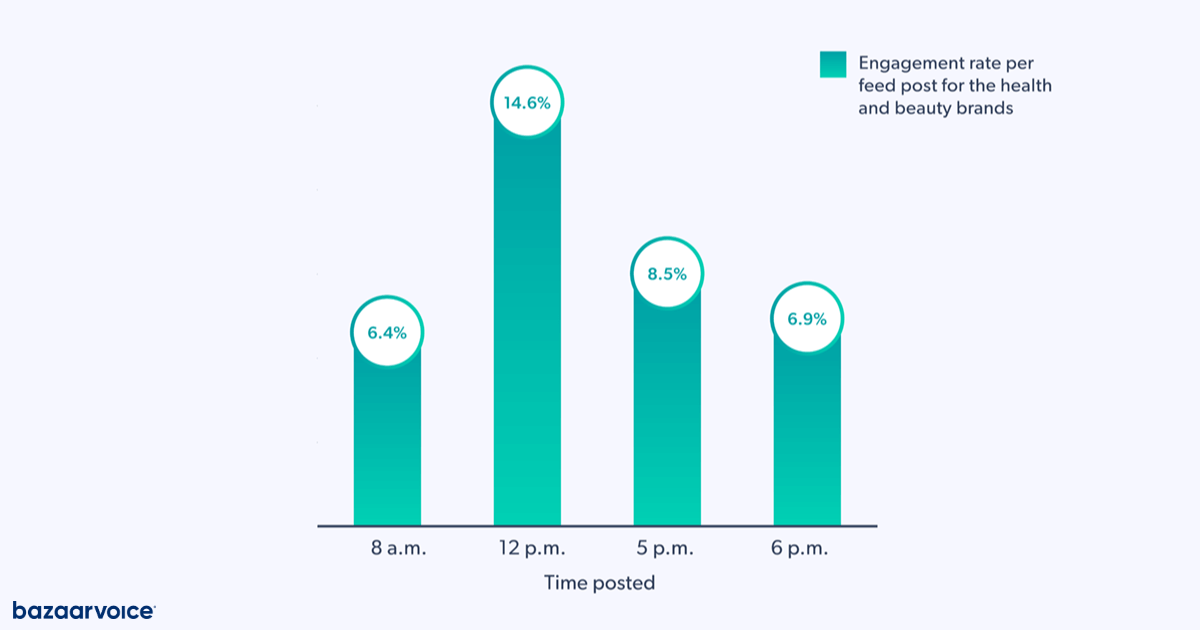
Taking a closer look, these times also vary by industry. For example, Health and Beauty brands can achieve a higher Engagement Rate by posting at 12pm EST:
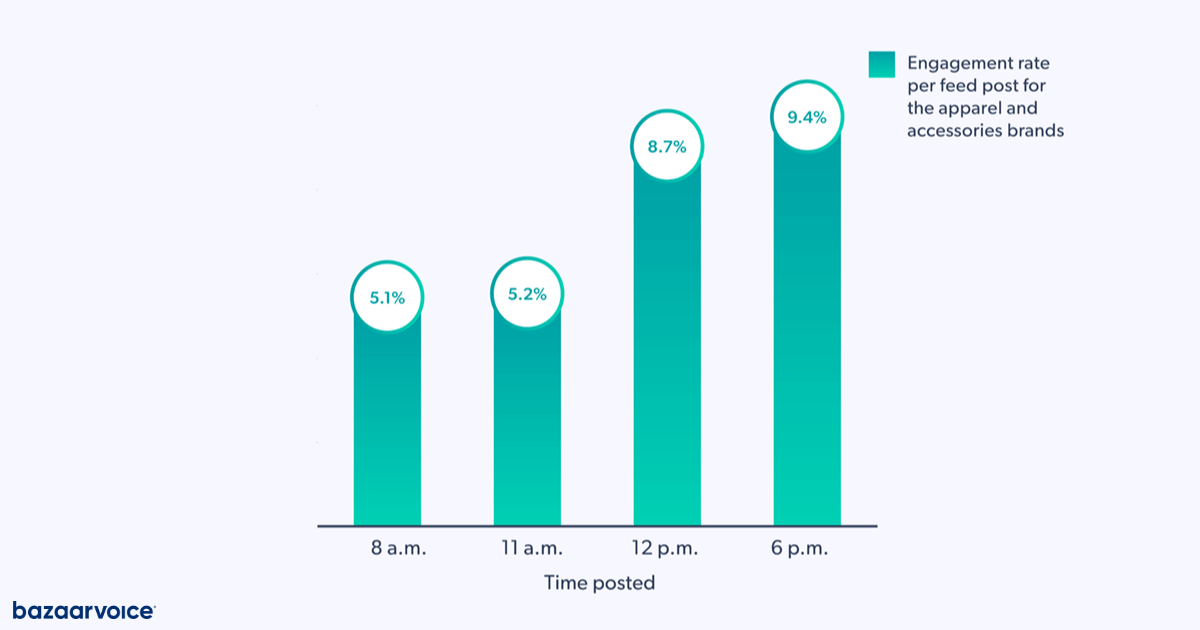
While the highest rates for the apparel and accessories industry are at 12pm and 6pm EST:
Beyond the time of day, other factors also impact Engagement Rate. The day of the week, holidays, the time zone of your target audience, and events, to name a few, all have influence.
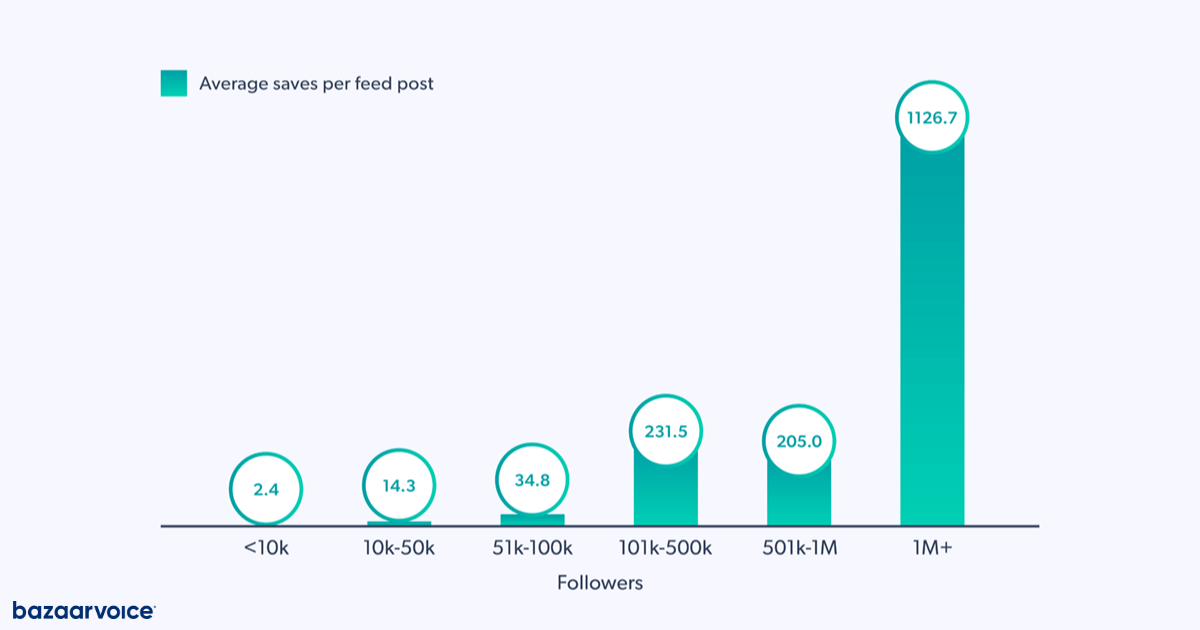
8. Instagram Average Saves
Don’t sleep on saves. The Instagram save feature allows users to save feed posts they want to come back to, indicating that the content is valuable or entertaining to them. It’s also a vital engagement factor for the Instagram ranking algorithm.
For this metric, we see that the number of saves per post corresponds with the number of followers the top-performing brands have. The higher the number of followers, the higher the number of saves — with one exception.
Brands with 501K to 1M followers have a slightly lower average save per post rate (205 saves/feed post) than the tier below them, 101K to 500K (231.5 saves/feed post).
Instagram Stories Metrics
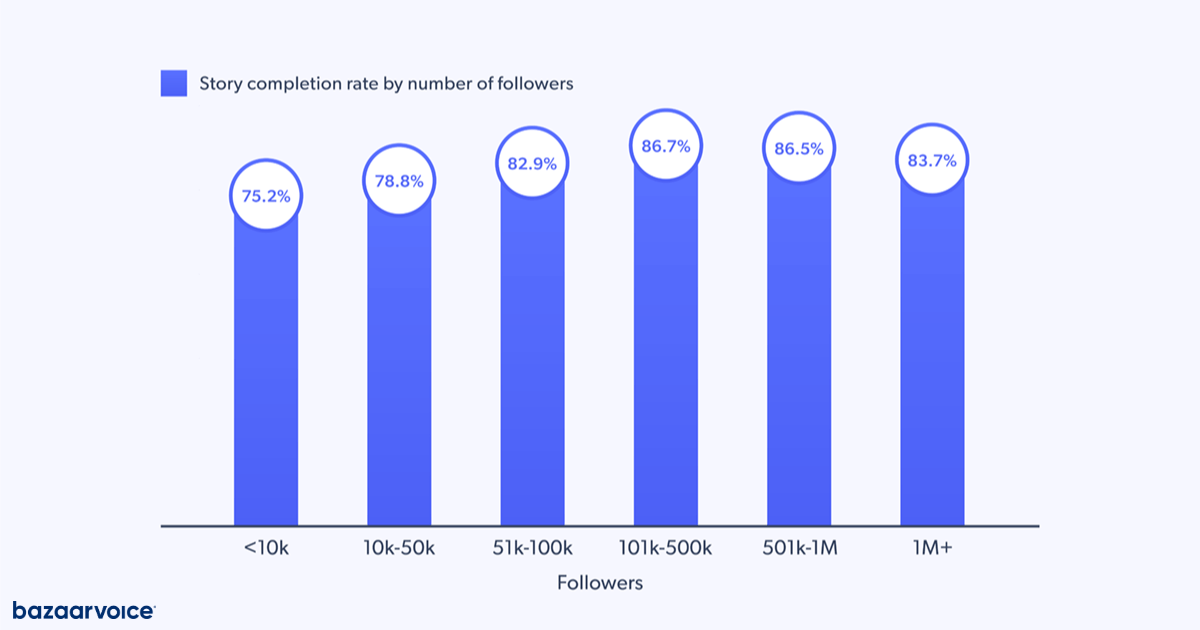
9. Instagram Stories Completion Rate by size
Definition: Completion Rate is how many people have watched an Instagram Story to the end.
Completion Rate = Number of people who viewed the last segment in your Story / Number of people who viewed the first segment
Your Stories Completion Rate indicates what type of content your followers enjoy and want to see more of. This metric will help inform your content strategy so that you can focus on creating content that resonates with and inspires your target demographic.
The average Stories Completion Rate across all categories and follower size is 82%. Our data shows that follower count and Stories Completion Rate have a positive correlation until the 1M mark, where it drops slightly below the previous tier.
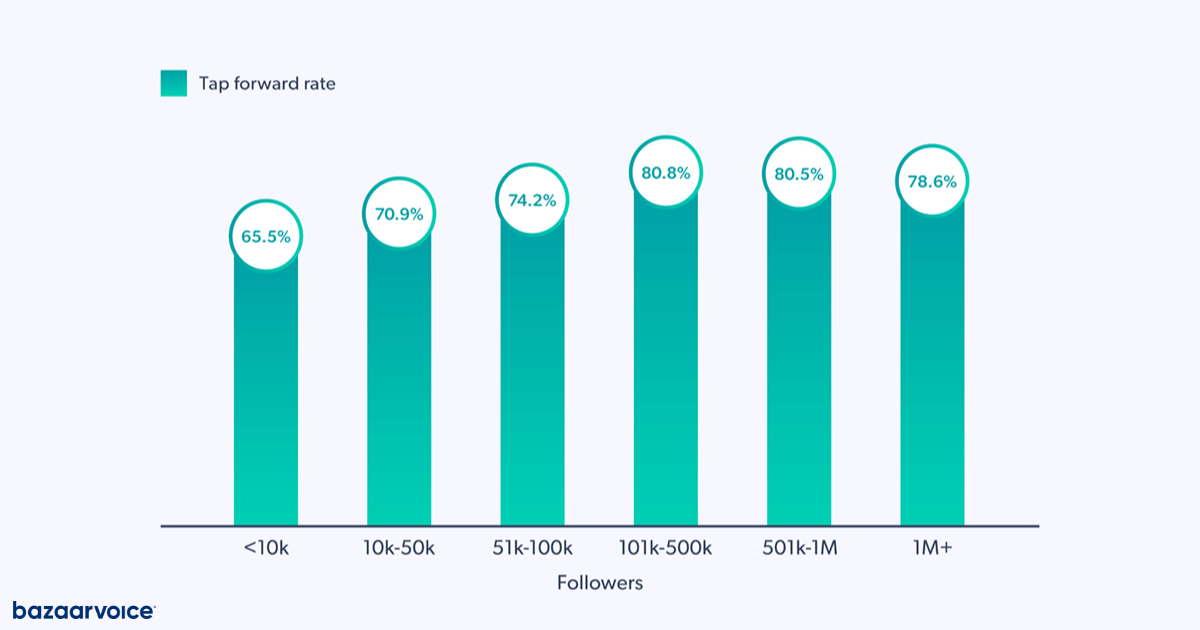
10. Instagram Stories Tap Forward Rate
Definition: Tap Forward Rate is the percentage of people who have tapped forward to see the next photo or video in an Instagram Story.
Tap Forward Rate = Taps / Impressions
A high Tap Forward Rate is a good indication that your followers want to see your Stories instead of swiping to the next Story from a different account. The average Tap Forward Rate of our top-performing brands is 75%.
Whether or not the number of Stories a brand posts per day affects engagement metrics is up for debate, with advice ranging from two to 10 daily posts for maximum impact. Adam Mosseri, head of Instagram, revealed that posting a couple of stories a day will keep followers engaged and support growth.
The bottom line: experiment with Stories to see which content and posting schedule works best by analyzing your Tap Forward Rate.
2024 Instagram metrics key findings
This year’s Instagram metrics mirror last year’s findings that smaller brands on Instagram have an advantage in many top performance areas:
- Reach Rate
- Conversion Rate
- Engagement Rate
However, large brands on Instagram outperform in a number of areas:
- Saves
- Story Completion Rate
- Story Tap Forward Rate
This pattern doesn’t apply to brands with 1M+ followers though, as that tier has a lower Story Completion Rate and Story Tap Forward Rate than both medium tiers before it.
The most notable change involves brands with medium to large followings in the 101K to 1M tiers. These brands have higher Story Completion Rates and Story Tap Forward Rates than brands with 1M+ followers.
The 101K to 500K tier has the second-highest Reach Rate, coming in after brands with less than 10K followers. Brands with 501K to 1M followers have the same Conversion Rate as the less than 10K tier but lower Average Saves than both the 101K to 500K and the 1M+ tiers.
Another notable difference from last year’s report is the optimal posting times. Compared to 2022’s early morning (7am EST) and mid-afternoon posting times (2pm EST), this year, you should tweak your posting schedule to publish content in the afternoon (3pm EST) and evening (8pm EST).
With smaller followings holding strong in some areas and medium followings moving up in others, this year’s Instagram insights show that brands of any size have the potential to boost follower growth, amp up engagement, increase brand awareness, and make 2024 a record performance year.
Get Instagram right with Social Publishing
These Instagram metrics provide accurate, usable benchmarks to guide your brand’s social strategy and determine social media ROI. If you adhere to them, you’ll start seeing positive results in no time at all. But imagine if you could get these metrics specifically for your brand only.
With Bazaarvoice Social Media Management, access every measurable metric (for all major social channels), easily determine the ROI of your social endeavours, and easily manage everything you need to win on social all in a single dashboard. You can read more about it here or get in touch below to learn more.
Get started